
Uncategorized
Casino Operator RFID ROI: Measuring the Return on Smart Tables
Deploying RFID technology across a casino table games floor represents a significant capital investment. Hardware, software, installation, training, and ongoing maintenance costs can total $1.5 million to $3 million for a property with 50-100 tables. Casino operators evaluating this investment require a clear, data-driven framework for calculating ROI. This article provides a comprehensive methodology for measuring the return on RFID-enabled smart tables, identifying the key value drivers, and building a business case that withstands executive and board-level scrutiny Smart Gaming Table.
Investment Components
The total cost of RFID deployment includes multiple components that must be aggregated to calculate the investment baseline:
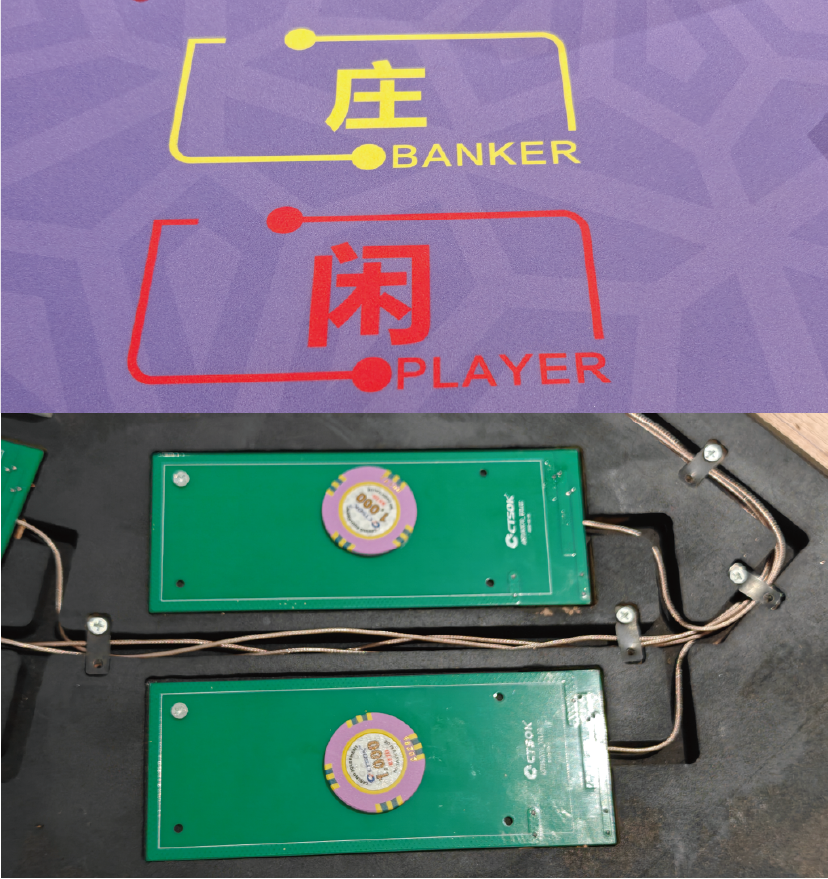
**Hardware.** The most visible cost component includes sensor boards (antenna arrays and controllers installed beneath each table), RFID readers at cage windows and count room portals, RFID-enabled chip trays and transport containers, and RFID tags embedded in each chip. For a property with 50 tables and 800,000 chips in inventory, hardware costs typically range from $800,000 to $1,200,000.
**Software.** The software layer includes the RFID middleware that reads and processes tag data, the table game management system (TGMS) integration, analytics and reporting platforms, and license fees for proprietary protocols. Software costs range from $200,000 to $400,000 for a mid-sized property, with annual license renewals of $50,000 to $100,000.
**Installation and configuration.** Professional installation includes removing felt from existing tables, installing sensor boards, reinstalling felt, configuring zone definitions, testing read accuracy, and integrating with existing casino management systems. Installation costs range from $150,000 to $300,000 depending on table count and floor complexity.
**Chip encoding.** If the property’s existing chips are not RFID-enabled, all chips must be encoded. Some chip manufacturers offer pre-encoded chips as part of new chip orders; properties that already have chips must encode them in batches. Encoding costs range from $0.15 to $0.35 per chip, totaling $120,000 to $280,000 for a property with 800,000 chips.
**Training.** Staff training covers dealers (understanding system alerts and display interfaces), pit managers (interpreting analytics dashboards), cage staff (using RFID-enabled windows), and IT staff (system maintenance and troubleshooting). Training costs range from $30,000 to $60,000 for initial deployment, with ongoing refresher training of $10,000 to $20,000 per year.

**Ongoing maintenance.** Annual maintenance includes hardware support contracts, software updates, periodic antenna calibration, and spare parts inventory. Ongoing maintenance ranges from $80,000 to $150,000 per year for a 50-table property.
For a typical mid-sized property, the total first-year investment ranges from $1.3 million to $2.2 million, with ongoing annual costs of $130,000 to $250,000.
Value Drivers
ROI calculation requires identifying all value drivers — the specific financial benefits that RFID deployment generates. The five primary value drivers for RFID smart tables are:
1. Chip Shrinkage Reduction
Chip shrinkage — the difference between expected and actual chip inventory — represents a direct financial loss. Industry estimates place annual shrinkage at 1-3% of total chip inventory value. For a property with $10 million in active chip inventory and 2% shrinkage, annual losses total $200,000.
RFID deployments consistently reduce shrinkage by 40-70%. A conservative estimate of 50% reduction yields an annual savings of $100,000. This is a hard-dollar benefit that flows directly to the bottom line.
2. Dealer Error Reduction
Dealer payout errors result in overpayments that directly reduce casino win. On a high-limit table, a single overpayment of $500 can offset the revenue from several hours of play. Industry studies estimate that dealer errors cost casinos 0.3% to 0.8% of table win annually.
RFID systems reduce dealer errors by 40-60% by providing real-time payout calculations and verification. For a property with $25 million in annual table win and an error rate of 0.5%, annual error losses total $125,000. A 50% reduction yields $62,500 in annual savings.
3. Increased Hands Per Hour
RFID systems streamline game operations by reducing the time required for chip counts, fills, and reconciliations. The cumulative time savings enable dealers to complete more hands per hour. Industry data suggests that RFID deployments increase hands per hour by 5-10%.
A 5% increase in hands per hour translates directly to a 5% increase in theoretical win. For a property with $25 million in annual table win, the increase yields $1.25 million in additional revenue. This is a soft-dollar benefit that requires dealers to actually deal more hands, but the enabling effect of RFID is well-documented.
4. Improved Player Tracking and Comp Optimization
RFID tables generate exact bet data for rated players, enabling more accurate player tracking and more efficient comp allocation. Traditional player tracking relies on time-based estimates that can over-rate low-activity players and under-rate high-activity players by 20-30%.
More accurate player tracking enables casinos to target comps more precisely, reducing comp spend on low-value players while maintaining or increasing comp spend on high-value players. For a property with $3 million in annual comp spend on table players, a 10% optimization yields $300,000 in annual savings without reducing player satisfaction.
5. Reduced Labor Costs
RFID automation reduces labor requirements in the count room, cage, and pit. Automated chip counting reduces count room labor by 60-75%, cage transaction processing is 30-50% faster, and pit managers spend less time on manual counts and reconciliations.
For a property with 20 full-time equivalent (FTE) staff in count room, cage, and pit support roles, a 15% reduction in labor requirements through RFID automation yields 3 FTE in savings. At an average fully-loaded cost of $45,000 per FTE, the annual savings total $135,000.
ROI Calculation Framework
With investment and value drivers quantified, ROI can be calculated using a standard framework:
**Year 1:**
– Investment: $1,500,000 (mid-point of range)
– Value: $100,000 (shrinkage) + $62,500 (errors) + $625,000 (hands per hour at 50% realization) + $150,000 (comp optimization) + $67,500 (labor at 50% realization) = $1,005,000
– Net: -$495,000
**Year 2:**
– Investment: $175,000 (ongoing maintenance, mid-point)
– Value: $100,000 + $62,500 + $1,250,000 (full hands per hour realization) + $300,000 + $135,000 = $1,847,500
– Net: +$1,672,500
**Year 3:**
– Investment: $175,000
– Value: $1,847,500
– Net: +$1,672,500
**Three-Year Cumulative:**
– Investment: $1,850,000
– Value: $4,700,000
– Net: +$2,850,000
**Payback Period:** 18-24 months
**Three-Year ROI:** 154% ($2,850,000 / $1,850,000)
This framework uses conservative assumptions. Properties with higher chip volume, higher table win, or more labor-intensive operations will achieve faster payback and higher ROI.
Sensitivity Analysis
Not all value drivers are equally certain. Shrinkage reduction and labor savings are hard-dollar benefits that realize immediately. Hands per hour increases and comp optimization require operational changes and may realize more slowly. Sensitivity analysis helps operators understand how variations in each value driver affect ROI.
**Scenario A: Conservative (50% realization of soft benefits)**
– Three-Year Net: +$1,650,000
– Payback: 22-28 months
– ROI: 89%
**Scenario B: Moderate (75% realization of soft benefits)**
– Three-Year Net: +$2,250,000
– Payback: 18-24 months
– ROI: 122%
**Scenario C: Optimistic (100% realization of soft benefits)**
– Three-Year Net: +$2,850,000
– Payback: 14-18 months
– ROI: 154%
Even in the conservative scenario, RFID deployment delivers positive ROI within three years. The range of outcomes provides executives with confidence that the investment is sound even if operational changes are slower than anticipated.
Intangible Benefits
Beyond quantifiable value drivers, RFID deployment delivers intangible benefits that support the business case:
**Regulatory compliance.** RFID audit trails satisfy regulatory documentation requirements in all major gaming jurisdictions. Properties with RFID tables are viewed more favorably during license renewals and table allocation reviews.
**Data asset creation.** The chip-level data generated by RFID tables is a strategic asset that supports marketing, operations, and capital planning decisions for years into the future. The value of this data increases over time as historical data enables predictive analytics.
**Competitive positioning.** In markets where RFID deployment is becoming standard (such as Macau), properties without RFID are at a competitive disadvantage for player trust and regulatory compliance. Early adoption establishes a property as a market leader.
**Fraud deterrence.** The presence of RFID monitoring deters dealer collusion, player cheating, and chip theft. Even when fraud incidents do not occur, the deterrence effect provides risk reduction that is difficult to quantify but valuable nonetheless.
These intangible benefits do not appear in ROI calculations but strengthen the business case for deployment.
Building the Business Case
When presenting RFID investment to executives and board members, operators should structure the business case around the following elements:
**Problem statement:** Quantify current shrinkage, error rates, labor costs, and data limitations. Establish the baseline from which improvement will be measured.
**Solution overview:** Describe the RFID deployment scope, timeline, and integration with existing systems. Emphasize that RFID is a proven technology with established vendors and successful deployments across the industry Macaumr Casino Supplier.
**Financial analysis:** Present the investment summary, value driver quantification, ROI calculation, and sensitivity analysis. Use conservative assumptions and show that the investment delivers positive returns even in worst-case scenarios.
**Risk mitigation:** Address implementation risks (hardware reliability, integration complexity, staff adoption) and describe the mitigation strategies (vendor support contracts, phased rollout, comprehensive training).
**Strategic alignment:** Connect the RFID investment to the property’s strategic objectives — revenue growth, cost optimization, regulatory compliance, player experience improvement.
The business case should be presented as a strategic investment that delivers measurable returns while positioning the property for long-term competitiveness, rather than simply a cost-reduction initiative.
Frequently Asked Questions
How long does it typically take to achieve positive ROI on RFID table deployment?
Most properties achieve positive ROI within 18-24 months when all value drivers are realized. Properties with high chip volume and high table win can achieve positive ROI in 12-18 months. The payback period depends heavily on the realization of soft benefits such as hands per hour increases and comp optimization, which require operational changes in addition to technology deployment.
What is the single largest value driver for RFID ROI?
For most properties, the hands per hour increase is the largest value driver, accounting for 50-70% of total value. However, this is also the most uncertain value driver because it requires dealers to actually deal more hands. Shrinkage reduction is the most reliable value driver — it realizes immediately upon deployment and is not dependent on operational changes.
How should we account for RFID investment in capital budgeting?
RFID investment should be categorized as a capital expenditure with a three- to five-year depreciation schedule, consistent with technology infrastructure. The ongoing maintenance costs are operating expenses. The value drivers are recognized as revenue increases (hands per hour) and expense reductions (shrinkage, labor, comp optimization). Most finance teams treat RFID as a capital investment with a 24-month payback period and a three-year NPV of $1-2 million.
Does RFID ROI differ between new construction and retrofit installations?
New construction installations are typically less expensive because the RFID infrastructure can be designed into the table specifications and floor layout from the beginning. Retrofit installations require additional labor to remove and replace felt, and may require creative cable routing in floors without raised access. However, the value drivers are identical for both scenarios, so the ROI difference is driven primarily by installation cost, not operational benefit. New construction ROI is typically 10-20% higher than retrofit ROI due to lower installation costs.
What happens to ROI if we deploy RFID on only some tables rather than the entire floor?
Partial deployment (high-limit tables only, for example) reduces the investment proportionally but also reduces the value proportionally. However, partial deployment can achieve faster ROI if the tables selected have the highest value driver potential — high-limit tables have higher shrinkage risk, higher error cost, and higher hands per hour revenue. A targeted deployment on 20% of tables might capture 50% of the total floor value. The optimal deployment scope should be determined through analysis of table-level value driver potential.